Feature
AI images, animated text and data visuals
Vidonto can add AI-generated images, animated headlines, lists that build point by point, and key figures and charts that appear when the narration says the numbers.
Updated
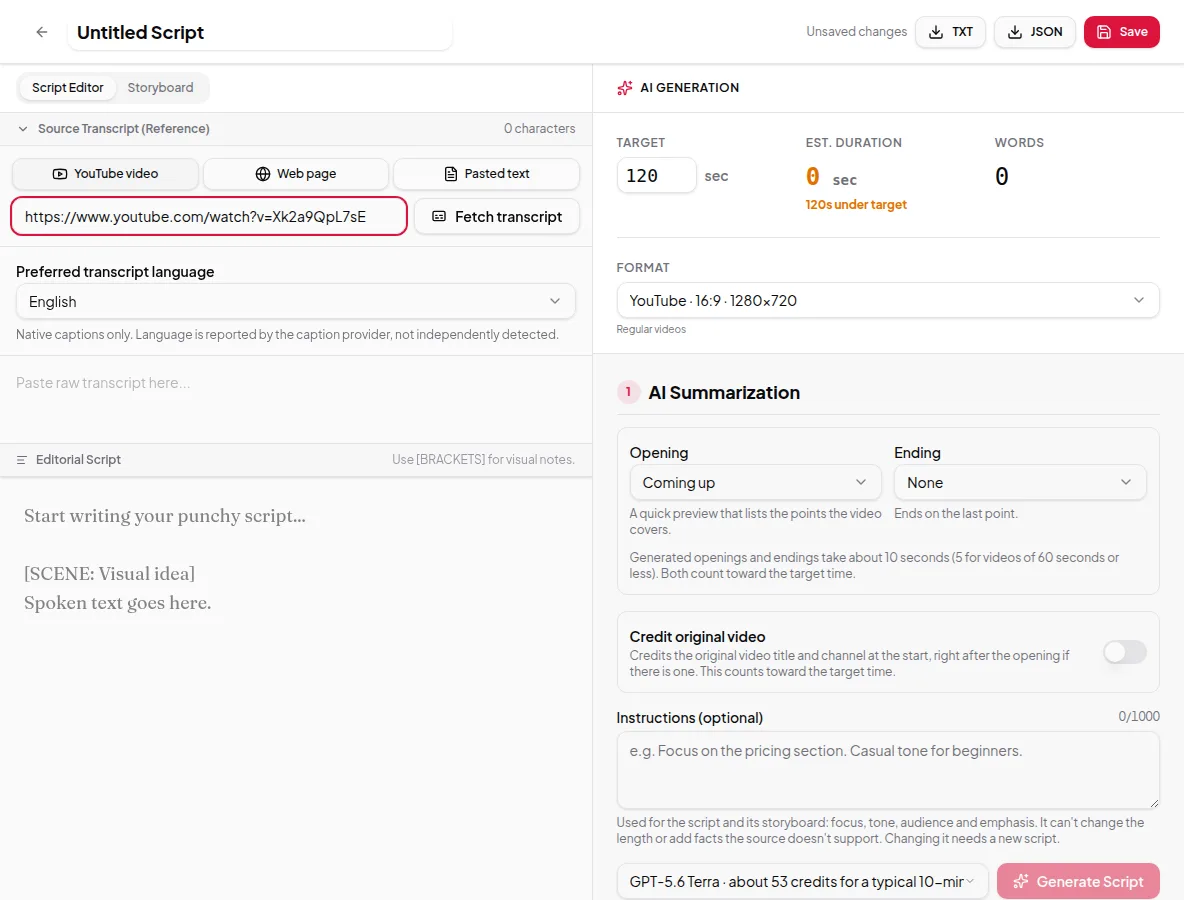
A summary video shouldn’t be a slideshow of the same title card. Vidonto plans the visuals frame by frame from the script: animated headlines and text, lists that build as each point is spoken, big key figures, simple charts and — if you turn them on — AI-generated images.
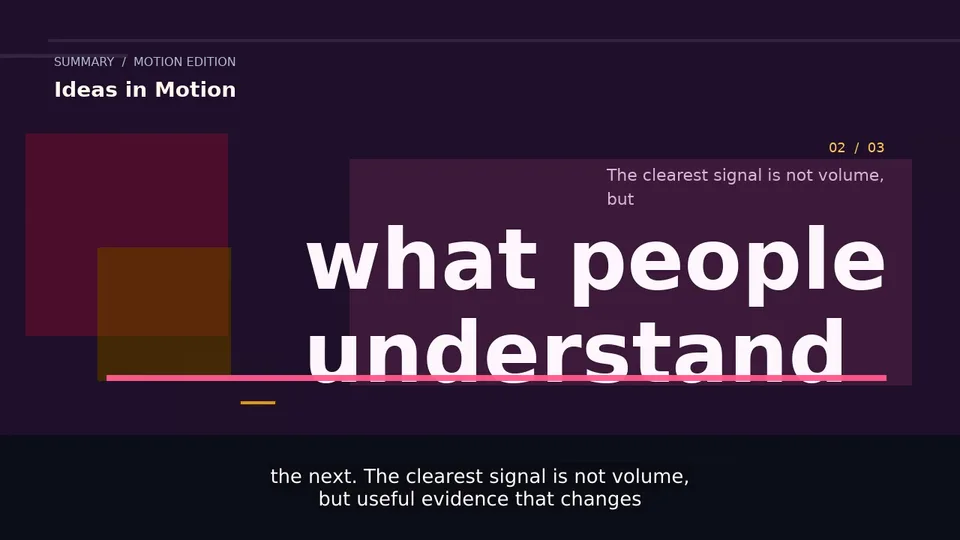
Text-led frames
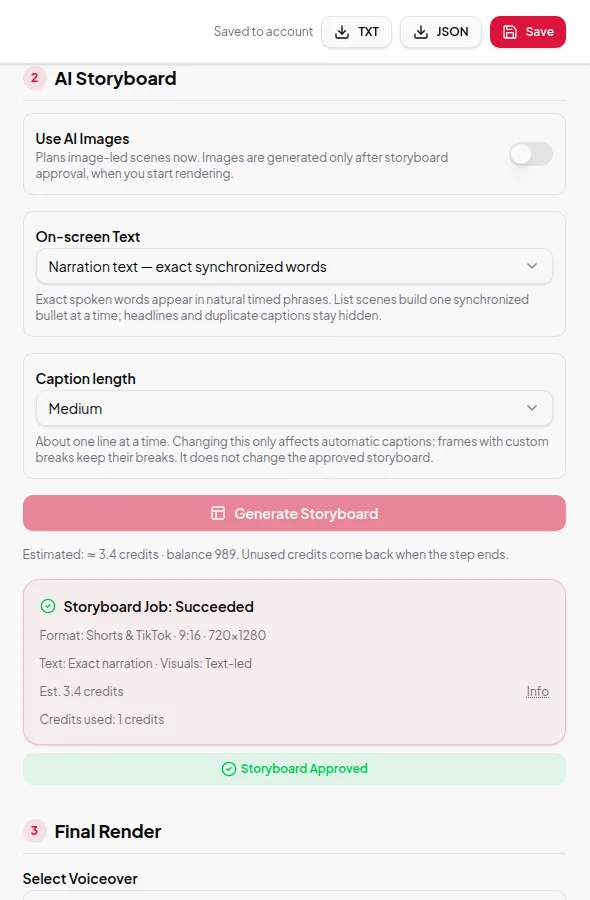
With AI images off, videos are text-led. Frames use animated headlines, supporting lines and captions on a styled background. Each video gets a consistent look, so frames feel like one piece rather than a set of templates.
Lists that build as you speak
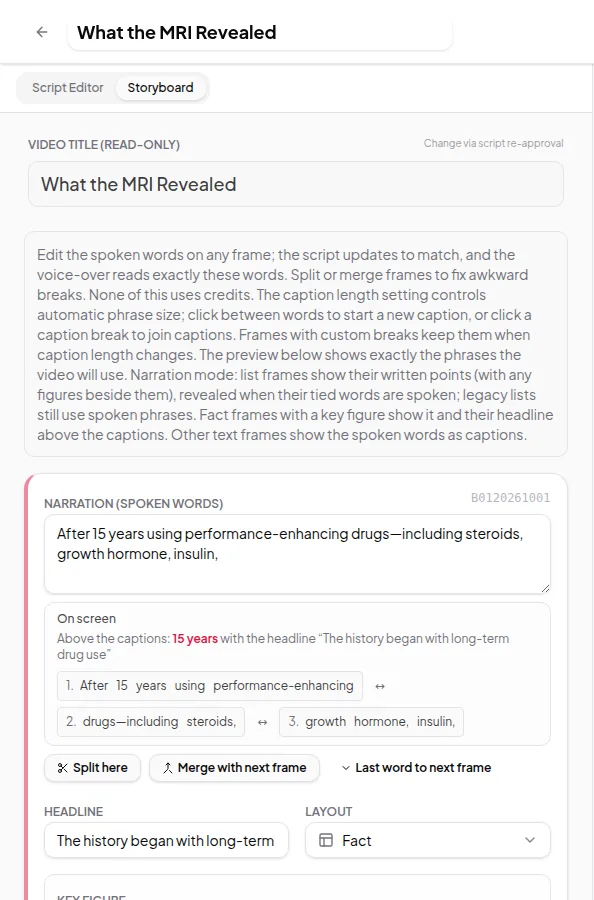
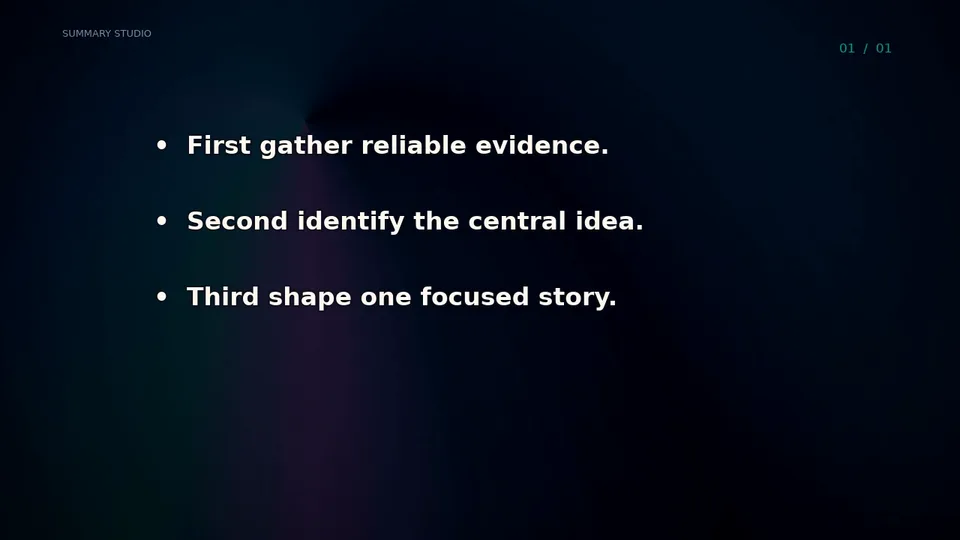
When the narration walks through a few items, the storyboard can use a list frame. Each point appears on screen when the voice reaches it, so viewers aren’t reading ahead of the narration. You can edit, add or remove points in the storyboard editor.
Key figures and charts
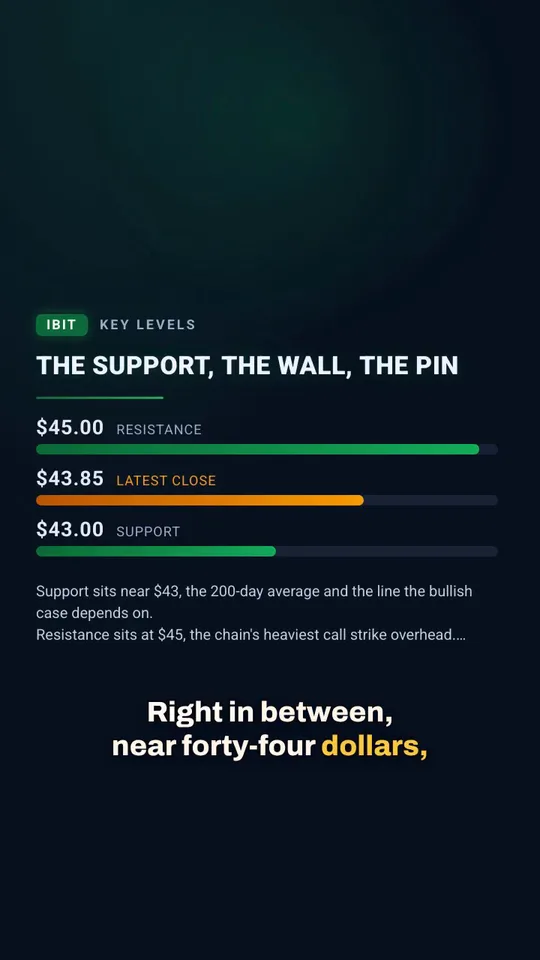
Numbers stick when you can see them. When the narration says a figure — a price, a percentage, a year-on-year change — a frame can show it as a large key figure, or show a few related values as a simple chart or a list of labels and values.
These visuals follow one strict rule: a number is only shown if the narration says it in that frame. The unit must match too — a spoken percentage is never shown as a dollar amount. If the AI proposes a figure that isn’t spoken, the frame falls back to text. If you edit the narration so a figure is no longer said, the editor tells you before you can save.
AI images
Turn on Use AI Images (Studio) or AI images (Quick Render) to plan image-led scenes. The storyboard then describes an image for suitable frames. Images are only generated after you approve the storyboard and start the render, so you can check the plan first without paying for pictures you might change.
Good uses for AI images:
- Abstract topics that are hard to show with text alone
- Story-driven sources such as interviews and histories
- Social posts where a picture stops the scroll
Leave them off for data-heavy or technical sources, where key figures and lists usually work better.
Limits worth knowing
- AI images are illustrations, not photos of real events or people. Don’t use them as evidence.
- Charts show simple comparisons of a few values. They aren’t a replacement for a full data visualization tool.
- You can’t upload your own images or logos into summary videos yet.
Credits
Text-led frames, lists, key figures and charts cost nothing extra. Each AI image uses credits, and the estimate before you start includes them. If AI images are off, nothing is charged for images. See credits explained.
See visuals in action in turn a blog post into a video.